
Boost On Time Delivery KPI in 30–90 Days for Operations Managers
On-time delivery, or OTD, measures the share of shipments that arrive by or before the date and time you promised a customer. Operations managers should track OTD alongside OTIF and Perfect Order rather than in isolation, since timeliness alone hides completeness and accuracy failures. The formulas, benchmarks, and fixes below follow.
TL;DR:
- Standardize the definition of “on time” to prevent varying reports and ensure trust in OTD metrics.
- Focus on fixing carrier transit failures and variability before warehouse processes to address the most common causes of late deliveries.
- Use real-time data integration from warehouse, order, and transportation systems to accurately track and improve OTD performance.
- Set OTD targets based on industry median benchmarks of 88 to 90 percent, adjusting for your own historical performance and transit variability.
- Consolidate shipping services with a single provider for better visibility and root-cause analysis, especially when current OTD performance is inconsistent.
Table of Contents
- OTD versus OTIF and Perfect Order: what each metric actually tells you
- How to calculate on-time delivery: formulas and worked examples
- Setting realistic OTD targets with industry benchmarks
- Why deliveries run late: root causes and a reason-code taxonomy
- Operational fixes that move OTD in 30 to 90 days
- Building a data pipeline you can trust for OTD reporting
- How a control tower and dock-level fixes raise OTD in practice
- Why OTD deserves a seat on the executive dashboard
- How Universal Shipping supports a higher OTD rate
- Sources
- FAQ
OTD versus OTIF and Perfect Order: what each metric actually tells you
OTD answers one question: did the shipment arrive when you said it would? It ignores whether the order was complete or damaged, which is why it works best as one input rather than the whole scorecard.
OTIF, or on time in full, adds completeness: the order must arrive on schedule and with every line item included. DIFOT (delivered in full, on time) is the same concept under a different name used in some industries. Perfect Order goes further still, multiplying on-time performance by completeness, damage-free condition, and accurate documentation into a single composite rate, a structure the SCOR model formalizes through component metrics like On Time and In Full.
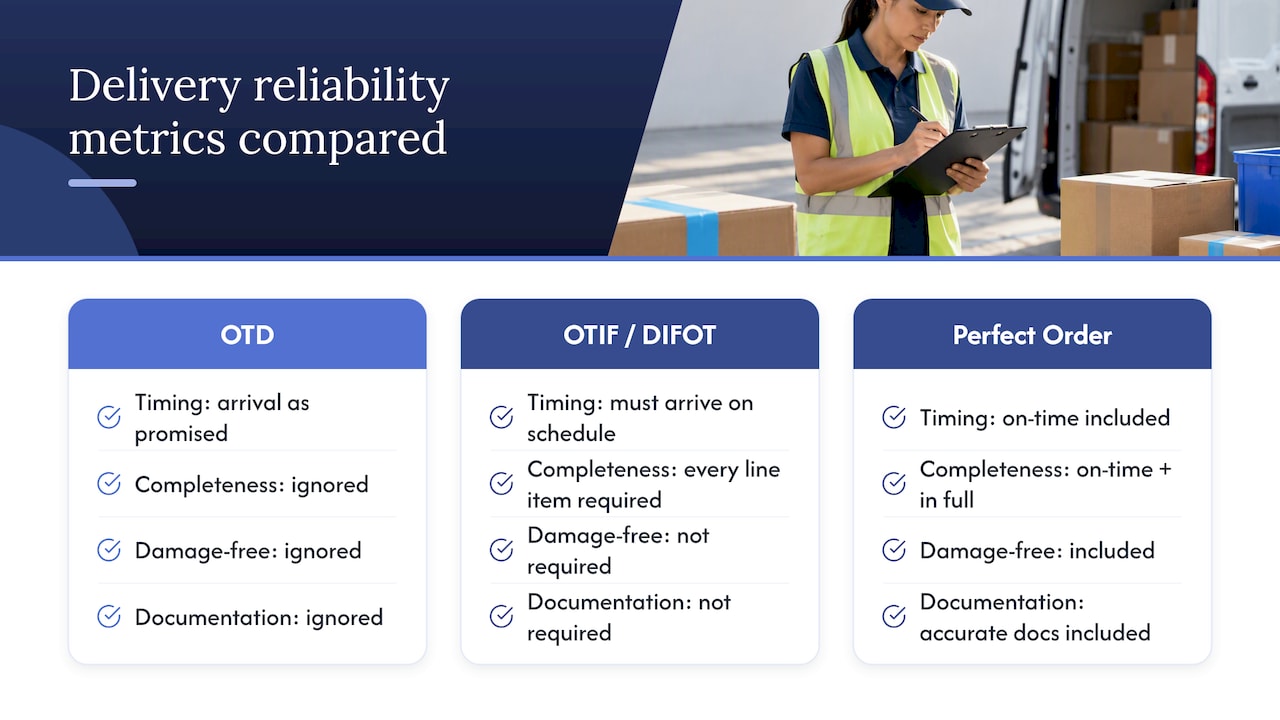
Use OTD when you need a fast read on carrier and dock timeliness. Use OTIF or Perfect Order when leadership wants a customer-facing reliability number. The trap most teams fall into is disagreeing on what “on time” means: delivered by the promised date, within a two-hour window, or within some buffer after it. Standardize that definition in writing before you start tracking, or every team will report a different number and nobody will trust the dashboard.
How to calculate on-time delivery: formulas and worked examples
The core formula is simple:
OTD rate = (number of on-time deliveries ÷ total deliveries) x 100
A delivery counts as on time when it arrives by or before the promised date, or, for time-window commitments, within the agreed window (for example, within four hours of the scheduled slot). Some operations add a grace buffer, similar in spirit to the 15-minute threshold the U.S. DOT uses for flight arrivals, which shows how much a single buffer choice changes the reported rate.
- Single order: an order promised for Tuesday that arrives Tuesday counts as on time; arriving Wednesday counts as late, regardless of the reason.
- Weekly rollup: sum on-time deliveries for the week, divide by total deliveries for the week, and multiply by 100.
- Split shipments: score each shipment segment independently, and count the order late if any segment misses its promised date.
- Backorders: measure from the revised promised date communicated to the customer, not the original date, since promising a new date resets the clock.
Decide upfront whether you measure at the order-line level or the order-header level. Exclude canceled orders from the denominator, keep returns in the dataset (a return does not undo a late delivery), and avoid drawing conclusions from samples under roughly 30 to 50 orders, since small samples swing wildly week to week.
Setting realistic OTD targets with industry benchmarks
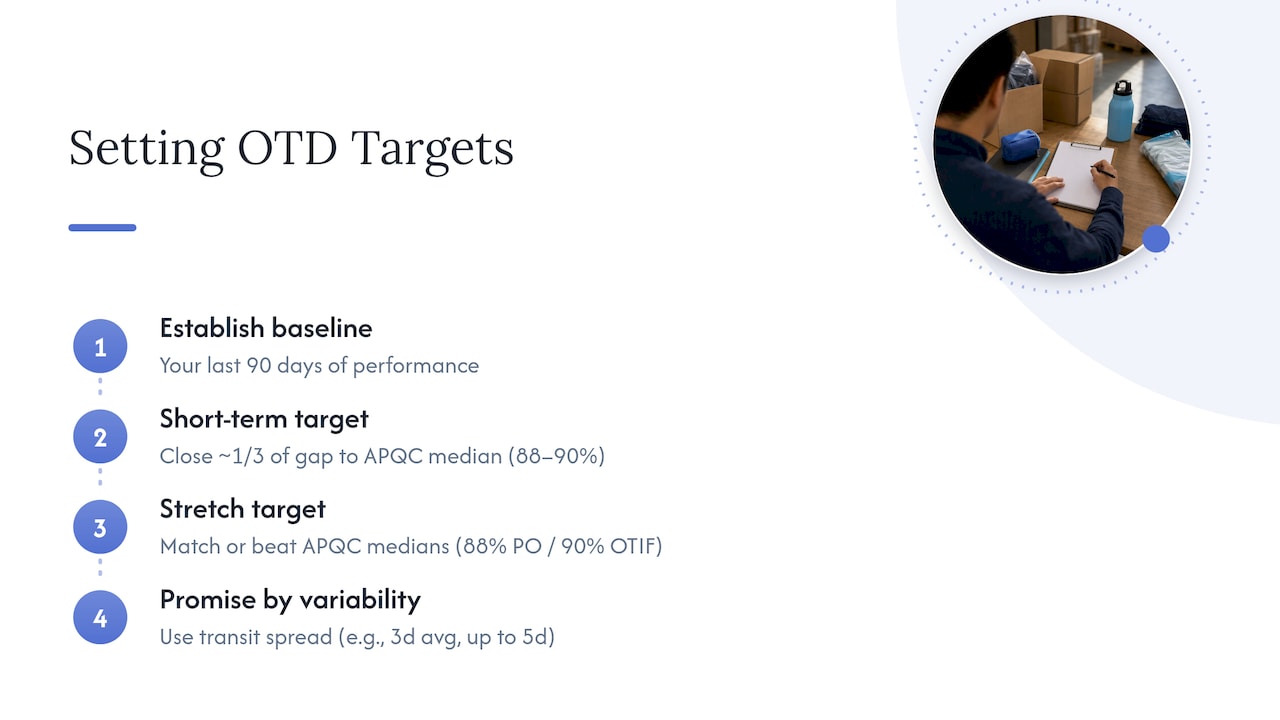
APQC’s benchmarking data put the median Perfect Order Fulfillment rate at about 88% across the organizations it surveys, a composite of on-time, complete, damage-free, and accurate-documentation rates. APQC’s separate OTIF measure reports a median close to 90% for orders delivered complete and on time.
Treat those medians as a reference point, not a target to copy blindly. Set a baseline from your own last 90 days of data, then set a short-term target that closes roughly a third of the gap to the median, and a stretch target that matches or beats it. Base your delivery promises on historical transit times and their variability, not on what sounds competitive. A carrier lane that runs three days on average but swings to five days one week in ten needs a promise that accounts for that spread, not just the average.
Why deliveries run late: root causes and a reason-code taxonomy
Late deliveries rarely trace back to one cause. The common culprits include:
- Inventory stockouts that delay order release past the promised ship date.
- Picking and packing errors that trigger a reship cycle.
- Carrier transit failures, including missed pickups, misroutes, and terminal delays.
- Address or documentation problems that stall delivery at the final mile.
- Weather and other force-majeure events outside anyone’s control.
Every late delivery should carry a reason code, without exception. A basic tree might branch from “warehouse,” “carrier,” “customer data,” and “external,” then split into specific sub-causes under each. Practitioners who cover Perfect Order performance point out that mandatory reason codes are what separate teams working from data from teams working from anecdotes.
Pro Tip: Require a reason code before a late-delivery ticket can close: skipped codes are the fastest way to lose the root-cause data you need three months from now.
Operational fixes that move OTD in 30 to 90 days
Fixing OTD works best as a sequence, not a scattershot of changes. Start where the data points, not where it feels most urgent; following fleet management best practices can help prioritize efforts effectively.
- Warehouse and process: fix slotting so fast-moving SKUs sit closest to pack stations, batch similar orders together, and correct pallet building so freight passes carrier inspection on the first attempt instead of getting held for rework.
- Transport and carrier management: build carrier scorecards that track on-time rates by lane, add SLA penalty clauses for chronic misses, and pad transit promises by a day or two on lanes with known variability, a practice detailed in guidance on estimating ZIP-to-ZIP LTL transit times.
- Inventory and planning: size safety stock to lead-time variability rather than a flat number of days, and make sure order-promising logic checks real inventory and transit data instead of a static delivery estimate.
- Technology and control tower: centralize real-time ETAs and route exceptions to the team that can act on them immediately, an approach control-tower logistics is built around.
Sequence these by measuring which lever affects the largest share of your late deliveries first. If your reason codes show most misses trace back to carrier transit failures, fix carrier scorecards and padding before touching warehouse slotting.
Building a data pipeline you can trust for OTD reporting
Pull OTD data from three systems: the warehouse management system for pick and ship timestamps, the order management system for the promised date, and the transportation management system for carrier pickup and delivery events.
- Reconcile carrier delivery confirmations against the promised date recorded at order entry, not a date edited after the fact.
- Cross-check manifests against what the customer actually received to catch data entry errors before they inflate or deflate the rate.
- Flag manual overrides with an audit trail; an override with no record behind it undermines the whole report.
- Report on a weekly cadence with drilldowns by reason code, and put the top-line rate on a dashboard leadership actually opens.
How a control tower and dock-level fixes raise OTD in practice
A control tower pulls TMS and WMS signals into one view, so a late pickup shows up as an exception before it becomes a missed delivery. Combining that visibility with lane-specific transit padding and dock-level fixes, like the corrections covered in guidance on the send-to-Amazon workflow, closes gaps that a single system never catches alone. When contracting a 3PL or freight forwarder, ask for a written OTD definition, a reason-code report, and a carrier scorecard as standard SLA deliverables.
Why OTD deserves a seat on the executive dashboard
Someone on your team should own this number, and it should sit where executives actually look, not buried in a monthly report nobody opens.
— Akbar
How Universal Shipping supports a higher OTD rate
Raising OTD usually means fixing the handoffs between warehouse, carrier, and customer promise, and that is where a fragmented setup tends to break down. Universal Shipping runs 3PL fulfillment, warehousing and fulfillment, and freight forwarding under one operation, so the reason-code data from a missed delivery does not get lost between three different vendors.

Relevant services for teams working on OTD include:
- Control-tower logistics for centralized visibility across carriers and warehouse events.
- 3PL fulfillment for order processing, pick and pack, and returns handling under one roof.
- FBA prep and last-mile delivery for sellers managing marketplace-specific dock requirements.
If your current OTD numbers are inconsistent and you cannot pin down why, start with a review of your current plans and services on the pricing page and request a diagnostic on where your promises and your actual transit performance diverge.
Sources
- Perfect order performance | APQC
- SCOR Model performance reliability RL.1.3
- Percent of time flight departures and arrivals | BTS (DOT)
FAQ
What is a good on-time delivery rate?
There is no single universal target, but APQC’s benchmarking data shows a median OTIF rate near 90% across surveyed organizations. Set your own target from your historical baseline first, then work toward that median as a short-term goal.
What is the difference between OTD and OTIF?
OTD measures only timeliness: did the shipment arrive by the promised date. OTIF adds completeness to that, requiring the order to be both on time and fully shipped, which is why a business can score well on OTD while still failing OTIF.
How do you calculate on-time delivery percentage?
Divide the number of on-time deliveries by the total number of deliveries in the period, then multiply by 100. Decide in advance whether “on time” means by a fixed date or within an agreed time window, since that choice changes the resulting rate.
Why is my on-time delivery rate inconsistent week to week?
Small sample sizes and inconsistent definitions of “on time” are the most common causes. Standardize your definition, track reason codes for every late delivery, and avoid drawing conclusions from weeks with fewer than roughly 30 to 50 orders.
Should backorders count in on-time delivery calculations?
Measure backorders against the revised promised date you communicated to the customer, not the original date. Excluding them entirely hides real performance problems, while scoring them against the original promise unfairly penalizes a delay you already disclosed.