
Last Mile Delivery Challenges: A Guide for Supply Chain Managers
The main cause of last-mile delivery losses is a mismatch between checkout promises and network delivery capability. Aligning delivery promises to real-time capacity at checkout reduces failed first attempts before dispatch, cutting the largest cost in last-mile operations.
Here is where to start today:
- Validate addresses at order entry. Bad address data causes a disproportionate share of failed attempts and re-delivery costs.
- Activate capacity-aware checkout. Stop promising same-day or next-day windows your network cannot honor during peak periods.
- Run a route optimization pilot on your highest-volume lane. Even a 30-day test on one zone will surface the gap between manual routing and algorithmic routing.
- Turn on proactive ETA notifications. A text or email 30–60 minutes before arrival cuts missed deliveries and inbound “where is my order” calls simultaneously.
- Audit your first-attempt success rate by zone. If you do not know this number, you cannot prioritize which fixes matter most.
Key Takeaways
Last-mile delivery accounts for a majority share of total shipping costs, making it the highest-leverage cost center a supply chain manager can target with operational fixes.
| Point | Details |
|---|---|
| Fix promises before routing | Capacity-aware checkout prevents failed attempts before a driver departs, cutting the costliest re-delivery cycle. |
| Route optimization pays fast | AI routing reduces route distance by 15%–20%, producing measurable savings within the first 30-day pilot. |
| Failed deliveries cost ~$17.20 each | Improving first-attempt success rate from 90% to 92% on 5,000 weekly orders saves meaningful costs annually. |
| Measure by zone, not network average | Segmenting first-attempt success rate by delivery zone reveals where 60%–70% of re-delivery cost concentrates. |
| Usiship offers a 30–90 day pilot | Usiship’s integrated fulfillment and transportation layer supports phased last-mile pilots with modeled cost savings before full rollout. |
Table of Contents
- What are the biggest last mile delivery challenges right now?
- How do last mile delivery costs and failures show up in U.S. operations?
- What tactical solutions actually improve last mile delivery?
- Which technology capabilities actually move the needle?
- How do you measure progress in last mile operations?
- What does a 30–90–180 day implementation roadmap look like?
- How Usiship approaches last mile challenges for U.S. operations
- A practitioner’s perspective on what actually matters
- Usiship can run a last-mile pilot with you in 30–90 days
- Sources
What are the biggest last mile delivery challenges right now?
Last-mile delivery, the final leg from a distribution hub to the customer’s door, is where supply chain complexity concentrates into a single, expensive moment. The challenges below are not theoretical. Each one has a direct cost or throughput consequence, and most operations are dealing with several at once.
Cost drivers. Distance, stop density, and failed attempts are the three primary cost levers. Low-density suburban and rural routes cost more per stop because fixed driver time and fuel spread across fewer deliveries. Failed attempts compound the problem: industry reporting puts the average cost of a single failed delivery at roughly $17.20 per order, including re-handling and re-delivery.
Rising customer expectations. Same-day and two-hour delivery windows, once a differentiator, are now table stakes in many categories. Quick-commerce and grocery delivery growth is accelerating demand for sub-day fulfillment, which stresses capacity planning and carrier mix simultaneously.
Routing inefficiencies. Manual route planning consistently underperforms algorithmic planning on distance, time, and fuel. The gap is not marginal: AI route optimization typically produces routes 15–20% shorter than manual planning and reduces driver hours on the same stop count.
Lack of visibility. Without real-time tracking at the stop level, operations teams cannot act on exceptions until a customer calls. Gartner identifies control-tower visibility and ETA accuracy as essential capabilities for reducing exceptions and coordinating multi-carrier operations.
Root causes include bad addresses, narrow delivery windows customers cannot honor, and no-access locations.
Driver retention and workforce shortages. Turnover in last-mile delivery roles runs high. Training costs, onboarding time, and the productivity gap between a new driver and an experienced one all show up in cost-per-stop figures.
Peak season capacity. Volume spikes during Q4 and promotional events expose every structural weakness in a network. Carriers hit capacity limits, rates surge, and service levels drop precisely when customer expectations are highest.
Returns and reverse logistics. A return is a last-mile problem in reverse, with the added friction of customer-initiated scheduling, condition assessment, and re-integration into inventory. Return transit time and cost are rarely tracked with the same rigor as outbound delivery.
Technology integration and data silos. Most operations run a patchwork of TMS, WMS, carrier APIs, and customer-facing tracking tools that do not share a common data layer. The result is manual exception handling, delayed ETAs, and planning decisions made on stale data.
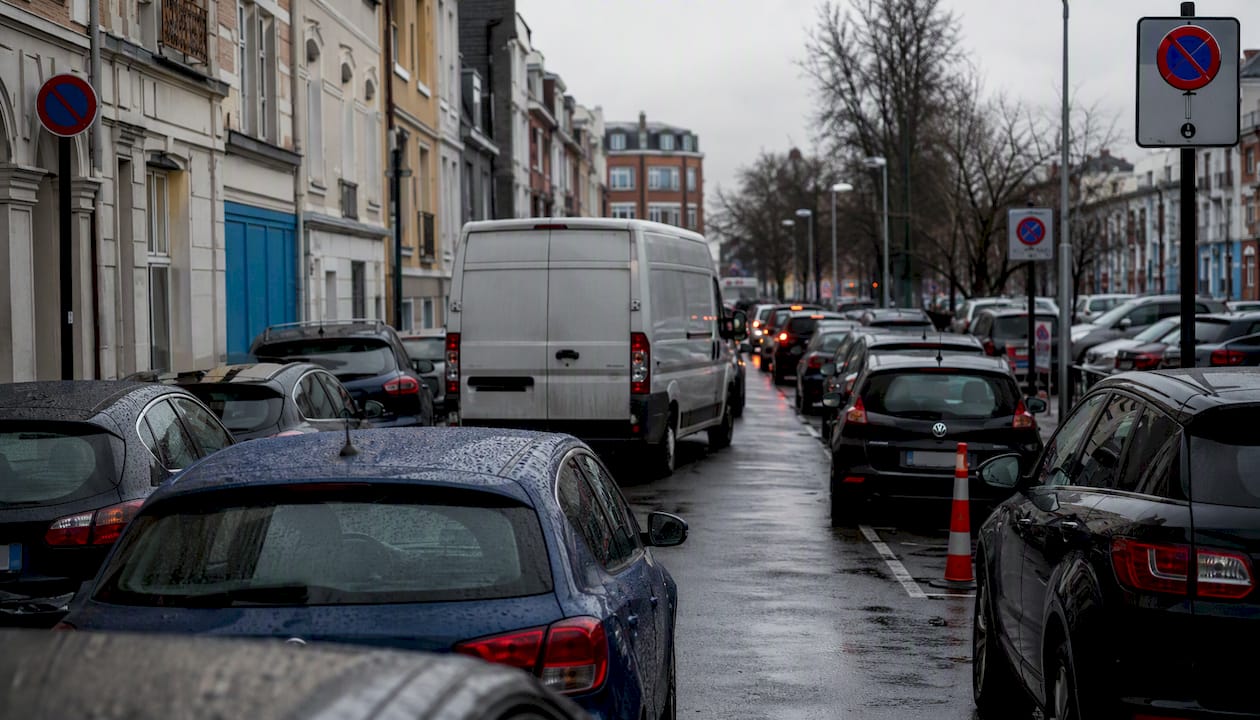
Urban delivery friction. Parking restrictions, curb access limits, and traffic congestion convert minutes-per-stop into large labor costs. Urban density and parking constraints are among the highest-impact non-technical constraints in city delivery operations.
Sustainability and environmental pressure. Fleet electrification, emissions reporting, and consolidation requirements are moving from voluntary to regulatory in many U.S. markets. The economics of EV adoption in last-mile are improving but still require careful route density analysis.
Theft and security. Porch piracy and cargo theft are measurable loss categories. Proof-of-delivery capture, photo confirmation, and secure drop options reduce both customer disputes and actual loss.
A useful framing: challenges like bad address data and checkout promises are upstream problems, fixable before a driver departs. Routing, driver behavior, and stop execution are execution-stage problems. Warehouse location and carrier network design are structural problems that take longer to fix but produce the largest unit-cost reductions.
How do last mile delivery costs and failures show up in U.S. operations?
The scale of the problem in U.S. e-commerce is not abstract. E-commerce’s share of total retail sales has grown steadily, and every percentage point of that shift adds last-mile volume to a network that was not designed for residential density.
Last-mile delivery accounts for a majority share of total shipping costs in most industry benchmarks, making it the single largest cost center in the supply chain. For a mid-size operation shipping 5,000 orders per week at an average shipping cost of $12, that means $2.5M–$3.2M per year spent on the final mile alone. A 10% efficiency gain in that segment is worth $250K–$320K annually, before accounting for reduced failed-delivery costs.
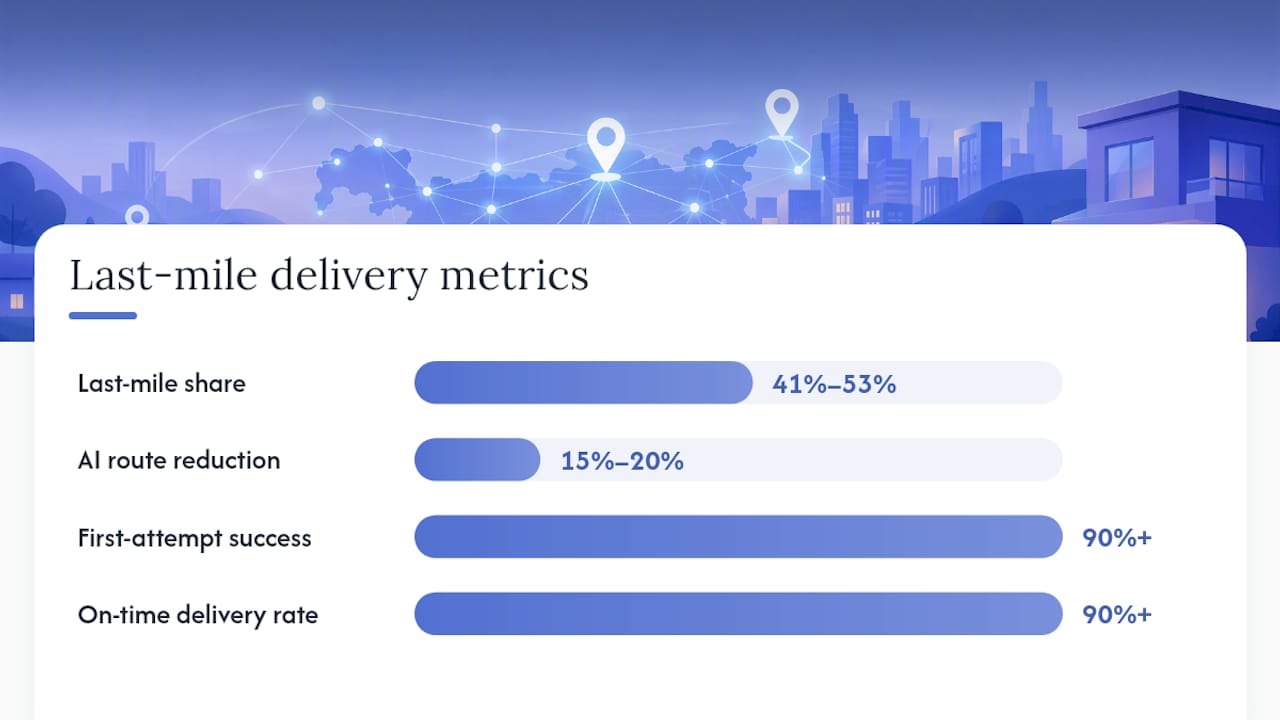
The Statista data on last-mile cost share consistently places the figure in the 41%–53% range across recent industry summaries, which aligns with what operations teams report when they fully load driver labor, fuel, carrier fees, and failed-attempt re-handling into their per-delivery cost.
| Metric | Typical U.S. Benchmark | Notes |
|---|---|---|
| Last-mile share of total shipping cost | 41%–53% | Varies by network density and carrier mix |
| Average cost of a failed delivery | ~$17.20 per order | Includes re-handling and re-delivery |
| Route distance reduction from AI optimization | 15%–20% | Versus manual planning on same stop set |
| First-attempt success rate (target) | 90%+ | Below 80% signals systemic address or promise issues |
| On-time delivery rate (target) | 90%+ | Urban routes typically outperform rural on this metric |
For a mid-size operation, the math on failed deliveries is particularly stark.
What tactical solutions actually improve last mile delivery?
The most effective fixes are not the most complex ones. Sequence matters: low-effort, high-impact changes first, structural changes later.
Address validation and geocoding (start here). Integrate address validation at checkout, not at dispatch. USPS Address Validation API and commercial geocoding tools like SmartyStreets or Google Maps Platform catch bad addresses before they become failed deliveries. This is the lowest-cost, highest-ROI fix in most networks.
Capacity-aware delivery promises. Aligning checkout promises to real-time network capacity prevents the downstream cascade of failed attempts, customer complaints, and re-delivery costs. This requires a live feed from your TMS or carrier capacity data into your checkout system, but the integration is typically lighter than teams expect.
AI route optimization. Move off manual or spreadsheet-based routing. Sequence-based loading, where the truck is loaded in reverse delivery order, compounds the time savings by eliminating in-vehicle search time at each stop.
Proactive customer communications. An automated ETA notification 30–60 minutes before arrival, with a real-time tracking link, reduces missed deliveries and cuts inbound customer service volume. This is a one-time integration with measurable impact on first-attempt success rate.
Carrier orchestration. For operations using multiple carriers, dynamic carrier selection by lane, time window, and cost reduces both rate and service variability. Score-carding carriers by lane-level on-time performance identifies where to shift volume before service failures accumulate.
Network repositioning. Forward-deployed inventory and micro-fulfillment nodes compress last-mile distance more than routing improvements alone. A spoke or dark store positioned 15 miles closer to a high-density delivery zone can reduce cost-per-stop by more than any routing algorithm applied to the existing network.
Demand-side interventions. Nudging customers toward locker pickup or consolidated delivery windows reduces home-delivery density and improves route efficiency without adding infrastructure. A small incentive, a discount or loyalty points, shifts a meaningful share of volume to lower-cost channels.
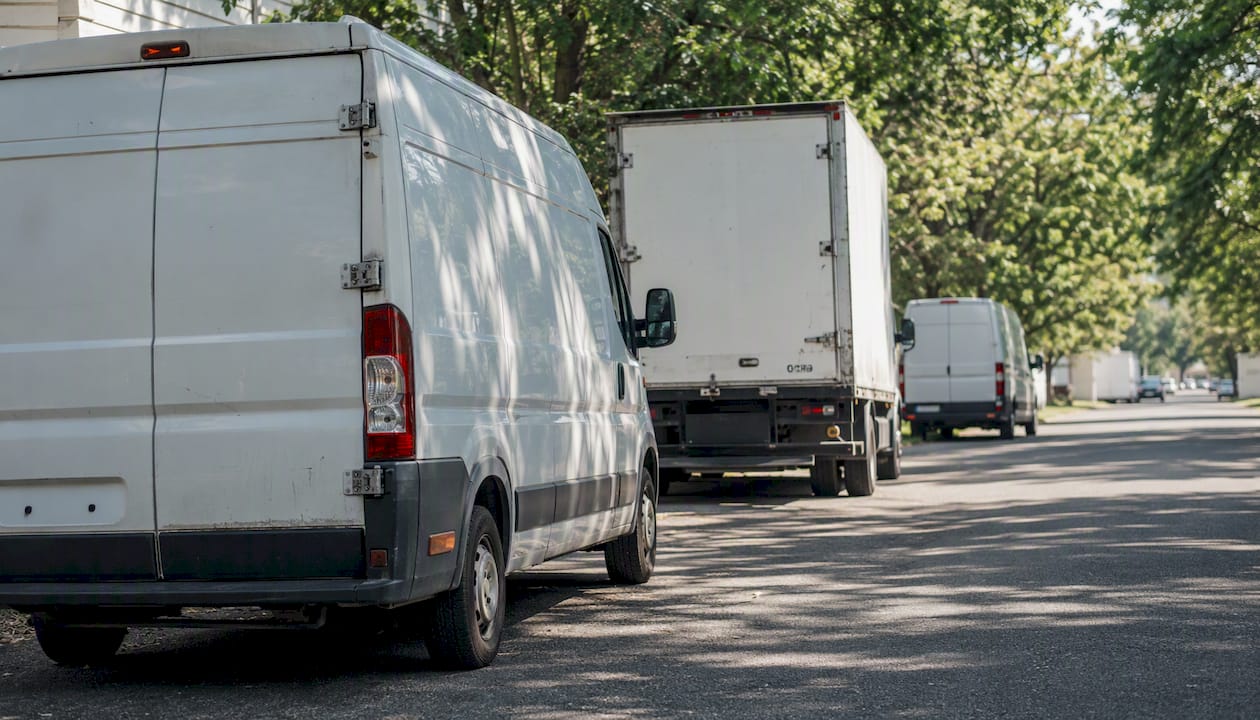
Right-sizing vehicles. Cargo vans on high-density urban routes and larger vehicles on suburban or rural routes reduce fuel and labor cost per stop. Specialty routes, such as furniture and white-glove delivery, require purpose-built vehicle selection that general-purpose fleets often get wrong.
Pro Tip: Before investing in carrier integrations, fix your routing. Teams routinely spend months building multi-carrier API connections while still planning routes manually. Carrier orchestration amplifies those savings but does not replace them.
Which technology capabilities actually move the needle?
Not all technology investments return equally. Here is a priority framework based on operational impact and implementation complexity.
Must-have capabilities
- AI route optimization with real-time re-optimization. The highest-ROI technology investment for most operations. Real-time re-optimization handles cancellations, add-ons, and traffic without manual dispatcher intervention.
- Address validation and geocoding. Catches bad data at the source. Non-negotiable for operations with more than a few hundred daily stops.
- ETA accuracy and customer communications. Live ETAs reduce missed deliveries and customer service load. Gartner’s guidance on delivery orchestration places ETA accuracy at the center of exception reduction.
- Proof of delivery capture. Photo confirmation and electronic signature reduce disputes and theft claims. Most modern delivery management systems include this natively.
Important capabilities
- Delivery orchestration and control tower. A single operational view across carriers, drivers, and stops lets dispatchers act on exceptions in real time rather than after the fact.
- Multi-carrier orchestration. Dynamic carrier selection by lane and time window reduces rate and service variability at scale. Enterprise operations with fragmented carrier bases see the largest gains here.
- Fleet telematics and EV integration. Real-time vehicle tracking, idle time monitoring, and EV range management reduce fuel cost and support sustainability reporting.
Nice-to-have capabilities
- Micro-fulfillment integration. Connecting forward-deployed inventory nodes to your TMS and WMS is high-value but requires network repositioning decisions first.
- Autonomous delivery integration. Drones and sidewalk robots are operationally viable in limited geographies. AI and autonomous delivery are shaping 2026 strategy, but consumer trust and regulatory frameworks still limit scale.
Integration pitfalls to avoid. Data silos between your WMS, TMS, and carrier APIs are the most common cause of stale ETAs and manual exception handling. Prioritize a shared data layer or middleware integration before adding new point solutions. Brittle carrier integrations, built on undocumented APIs or carrier-specific EDI formats, break during peak season when you can least afford it. Build to carrier API standards and maintain fallback routing rules.
How do you measure progress in last mile operations?
You cannot improve what you do not measure. These KPIs give operations teams the numbers they need to run a pilot, report to leadership, and decide when to scale.
Track cost per delivery and first-attempt success rate weekly during any pilot. Both respond quickly to routing and promise changes, so you will see signal within two to three weeks of implementing a fix. On-time delivery rate and stops per route are better monthly metrics, since they reflect network-level patterns rather than individual route variability.
Pro Tip: *Segment your first-attempt success rate by zip code or delivery zone, not just as a network average.
What does a 30–90–180 day implementation roadmap look like?
A phased approach lets you validate fixes before committing capital and gives leadership visible checkpoints.
Phase 1: Audit and quick wins (Days 1–30)
- Pull your last-mile cost data: total cost, cost per delivery, and failed-delivery count by zone.
- Calculate your current first-attempt success rate by zone and carrier.
- Audit address data quality: what percentage of your orders have address validation errors at entry?
- Review your checkout delivery promise logic: is it capacity-aware, or does it promise a fixed window regardless of network load?
- Identify your highest-volume delivery zone and pull route data for a 30-day sample.
- Map your current carrier mix and score each carrier by lane-level on-time performance.
- Quick win: activate address validation at checkout if not already in place.
- Quick win: turn on proactive ETA notifications for your highest-volume zone.
Phase 2: Pilots (Days 30–90)
- Run a route optimization pilot on your highest-volume zone using an algorithmic routing tool. Measure route distance, driver hours, and fuel cost versus the prior 30-day baseline.
- Implement capacity-aware delivery promises on your e-commerce checkout for the pilot zone.
- Launch a customer communications pilot: automated ETA notifications 30–60 minutes before arrival.
- Set success criteria before the pilot starts: a 10% reduction in route distance, a 5-point improvement in first-attempt success rate, and a measurable reduction in inbound “where is my order” contacts.
- Review carrier scorecards and shift 10–15% of volume on underperforming lanes to a backup carrier.
Phase 3: Scale and governance (Days 90–180)
- If the routing pilot hits its targets, roll out algorithmic routing across all zones. Establish a governance process for route template updates and seasonal adjustments.
- Evaluate 3PL versus in-house last-mile for zones where your cost per delivery exceeds the 3PL market rate by more than 20%.
- Begin network repositioning analysis: model the cost-per-stop impact of a forward-deployed inventory node in your highest-density delivery zone.
- Build a carrier orchestration framework: dynamic carrier selection rules by lane, time window, and cost threshold.
- Decision checkpoint at Day 120: if cost per delivery has not moved by at least 8% from baseline, revisit network positioning before adding more technology.
- Sustainability checkpoint: assess EV viability for your highest-density urban routes based on range, charging infrastructure, and total cost of ownership versus diesel.
How Usiship approaches last mile challenges for U.S. operations
Usiship’s integrated model connects fulfillment, transportation, and tracking into a single operational layer, which removes the data-silo problem that undermines most last-mile improvement efforts. Rather than patching together a WMS, a TMS, and a carrier API layer from separate vendors, Usiship operates these as a unified system across all 50 U.S. states.
Capabilities relevant to last-mile improvement pilots include:
- Omnichannel and e-commerce fulfillment with forward-deployed inventory positioning to reduce last-mile distance and cost per stop.
- Optimized warehouse solutions that support network repositioning decisions and micro-fulfillment integration.
- Full logistics and transportation services including FTL, LTL, and route-capable assets for carrier mix and right-sizing decisions.
- Real-time tracking and technology-driven visibility across the delivery lifecycle, from warehouse departure to proof of delivery.
- Carrier orchestration across a multi-carrier network, with lane-level performance data to support dynamic carrier selection.
- Customs clearance and cross-border handoff capabilities for operations with international inbound flows feeding domestic last-mile.
For operations running a 30–90 day pilot, Usiship’s approach starts with a capability assessment: mapping your current cost per delivery, first-attempt success rate, and carrier mix against the benchmarks in this guide, then identifying the two or three fixes with the highest modeled impact before any capital is committed.
A practitioner’s perspective on what actually matters
The field deployments that produce real results share three characteristics that most planning documents miss.
First, the teams that improve fastest are the ones that measure first-attempt success rate by zone before they do anything else. Fix the zone, not the average.
Second, over-architecting carrier integrations before fixing routing is the most common way teams waste the first 60 days of a pilot. A multi-carrier orchestration layer built on top of manual routing produces marginal gains. Routing optimization built on top of a single carrier produces large ones. Sequence matters more than sophistication.
Third, the behavioral interventions, locker pickup incentives, consolidated delivery window options, sustainability messaging, are underused and undervalued. They do not require technology investment.
The honest caution: AI and autonomous delivery are real, but they are not a substitute for getting the fundamentals right. Operations that have not fixed address validation, routing, and capacity-aware promises will not get meaningful value from drone delivery or predictive ETAs. The operational backbone has to work before the advanced capabilities compound it.
Usiship can run a last-mile pilot with you in 30–90 days
Most last-mile cost problems are diagnosable in two weeks and fixable in 90 days, if you have the right operational layer underneath. Usiship’s pilot assessment starts with your actual cost-per-delivery and first-attempt success rate data, models the impact of routing, promise, and network fixes against your specific zone mix, and delivers a scoped pilot plan with projected savings before you commit to a full rollout.
The assessment covers your carrier mix, address data quality, routing baseline, and fulfillment positioning, and it produces a 30–90 day pilot scope with defined success criteria. To get started, visit Usiship’s logistics and transportation services page or explore omnichannel fulfillment capabilities to see how forward-deployed inventory fits your network.
Sources
- Last-Mile Delivery Best Practices for 2026 • EasyRoutes
- Last-Mile Delivery: Solve Supply Chain Challenges – Gartner
- The final frontier: Navigating the last-mile paradox in 2026 – Supply Chain Management Review