
ABC Inventory Analysis: Why A, B, and C Need Different 3PL Rules
ABC inventory analysis classifies SKUs by annual consumption value so you can focus controls and cash on the small set of high value items that drive most of your results. The method relies on simple math you likely already have in your system data. Below, we walk through the formula, a worked example, and how the classification changes day-to-day warehouse decisions.
TL;DR:
- Calculate annual consumption value by multiplying unit cost by annual usage, then sort SKUs and assign A items through roughly 70% to 80% of cumulative value.
- Classify inventory by warehouse when local demand differs; a companywide C item can behave like an A item at a fast moving site.
- Count A items monthly or more often, B items quarterly, and C items twice yearly or less; place A stock near pack stations.
- Remove obsolete stock, returns, and damaged goods before calculating, because distorted cost or usage can leave a SKU misclassified for months.
- Review fast moving categories monthly and slower industrial lines quarterly; test automated classifications against a manual review for one full cycle.
Table of Contents
- What is ABC analysis and how do the categories work
- How ABC analysis relates to the Pareto principle
- Step-by-step calculation: data, formulas, and classification rules
- Worked example: calculating ABC categories step by step
- How to perform ABC analysis operationally
- Best practices for KPIs, storage rules, and automation
- Using ABC to prioritize cycle counting and audits
- Limitations and when to extend ABC with XYZ or optimization
- Applying ABC analysis in warehouse and 3PL workflows
- A practical note on keeping ABC useful
- How Universal Shipping helps you operationalize ABC controls
- FAQ
- Sources
What is ABC analysis and how do the categories work
ABC analysis sorts your inventory into three tiers based on annual consumption value, which is unit cost multiplied by annual units sold or used. Value, not unit price or order frequency alone, is what matters here: a cheap item ordered constantly can outrank an expensive item that barely moves.
The three tiers typically break down this way, according to CIPS:
- A items typically make up a small share of SKUs but account for the large majority of total consumption value, and they deserve tight controls, frequent counts, and close forecasting attention.
- B items generally cover a moderate share of SKUs and a moderate share of value, warranting moderate oversight and periodic review.
- C items typically make up the largest share of SKUs but only a small share of value, so they’re managed with simpler rules like bulk reordering or periodic review instead of tight control.
These patterns are starting points, not fixed rules. Set your cutoffs based on where the cumulative value curve actually bends in your own data, not a textbook split.
How ABC analysis relates to the Pareto principle
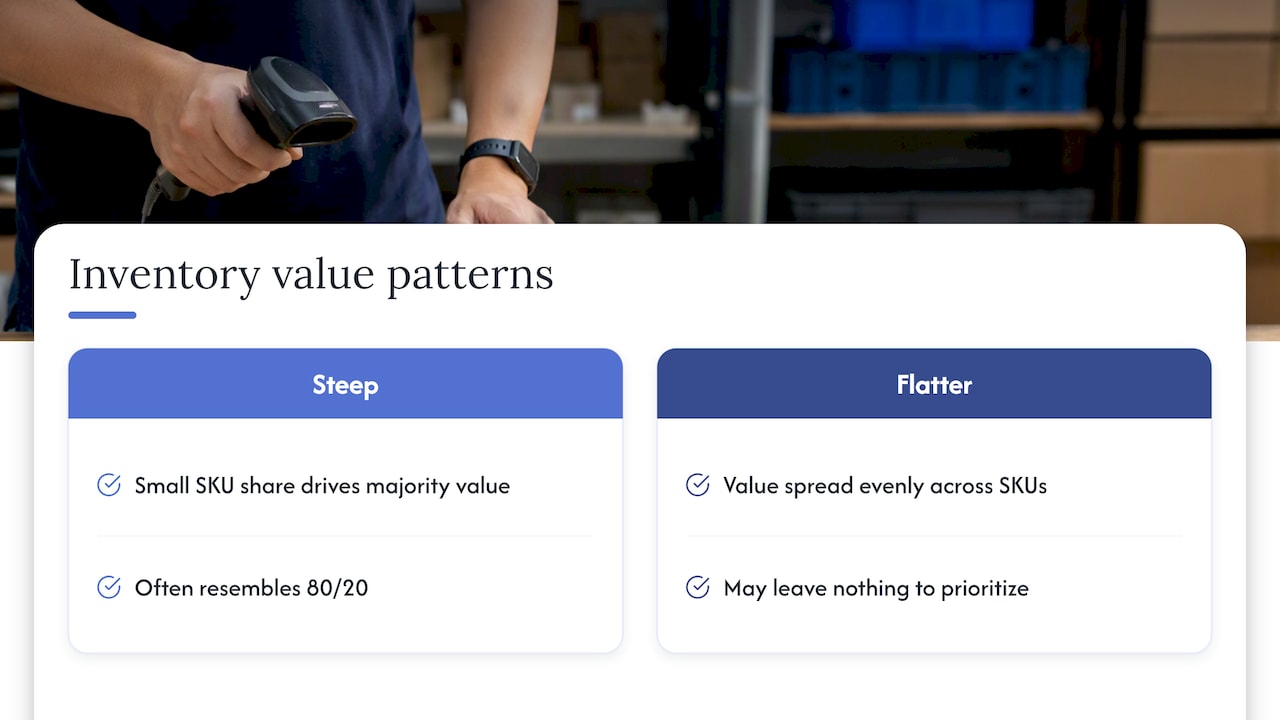
ABC analysis is a direct application of the Pareto principle, the observation that a small share of inputs tends to produce most of the outcome. In inventory terms, a minority of SKUs typically generates the majority of consumption value, which is why the A/B/C split so often resembles an 80/20 pattern.
Many inventories show steep value concentration, with class A items representing a small fraction of SKUs but the large majority of total value, per CIPS. That concentration is what makes ABC worth doing at all: if value were spread evenly across every SKU, there would be nothing to prioritize.
That said, Pareto is a pattern, not a law. Businesses with highly uniform products, tight margins across the board, or regulatory requirements that force equal attention to every SKU may see a flatter distribution. Always plot your own cumulative value curve before assuming an 80/20 split applies.
Step-by-step calculation: data, formulas, and classification rules
Running ABC analysis requires a handful of fields pulled from your inventory or ERP system: SKU identifier, unit cost, annual units sold or consumed, and storage location if you manage multiple warehouses.
- Calculate annual consumption value for each SKU: unit cost multiplied by annual units sold or used.
- Sort SKUs in descending order by consumption value, highest to lowest.
- Calculate cumulative value and cumulative percentage of the total, running down the sorted list.
- Set cutoffs and assign classes. A common approach labels SKUs A up to roughly 70 to 80% cumulative value, B up to about 90 to 95%, and C for the rest.
If you operate multiple warehouses, decide whether to classify company-wide or per location. A SKU that’s a C item company-wide might behave like an A item at a single fast-moving location, so per-location classification often gives sharper control for replenishment and counting decisions. Strip out one-time returns, damaged-goods write-offs, and clearly obsolete SKUs before running the math, since they distort both cost and volume inputs.
Pro Tip: Flag SKUs sitting within a few percentage points of a cutoff and review them manually. A borderline item can flip categories from one quarter to the next due to a single large order, so don’t let the formula override common sense on close calls.
Worked example: calculating ABC categories step by step
Say you manage eight SKUs with the following annual consumption values, already sorted from unit cost multiplied by annual units:
- SKU-1: $180,000 (cumulative 36%) – Class A
- SKU-2: $150,000 (cumulative 66%) – Class A
- SKU-3: $70,000 (cumulative 80%) – Class A
- SKU-4: $40,000 (cumulative 88%) – Class B
- SKU-5: $25,000 (cumulative 93%) – Class B
- SKU-6: $15,000 (cumulative 96%) – Class C
- SKU-7: $12,000 (cumulative 98.4%) – Class C
- SKU-8: $8,000 (cumulative 100%) – Class C
Total consumption value here is $500,000. Classifying SKU-3 determines whether it gets weekly cycle counts or a quarterly check.
How to perform ABC analysis operationally
Getting the math right is one thing. Making it run as a repeatable process is another. Start by pulling clean data: exclude discontinued SKUs, normalize unit cost fields so promotional or landed-cost variations don’t skew results, and confirm your units-sold figure reflects actual usage, not just orders placed.
- A spreadsheet works fine for a few hundred SKUs reviewed quarterly.
- Once you’re managing thousands of SKUs or need monthly updates, push the calculation into your ERP, WMS, or a BI tool with automated data feeds.
- Fast-moving consumer categories often warrant monthly reclassification, while slower industrial parts can run on a quarterly cycle.
- Ownership typically sits with inventory or operations management, with finance weighing in on cost inputs and purchasing acting on the output.
ABC results feed directly into reorder points and safety stock targets: A items usually get higher safety stock and more frequent reorder triggers to avoid stockouts, while C items can run leaner with larger, less frequent batches. The classification also shapes supplier conversations, since A-item suppliers are worth closer collaboration on lead times and pricing given how much spend they represent.
Pro Tip: Before automating reclassification, run it in parallel with your manual process for one full cycle to confirm the automated output matches what a human reviewer would flag.
Best practices for KPIs, storage rules, and automation
Translating classification into policy means attaching different KPIs and physical rules to each tier.
- Track turns, stockout rate, and days of supply closely for A items, since these carry the highest cost of error.
- Monitor carrying cost and review B items periodically, adjusting reorder quantities as demand shifts.
- Minimize handling cost for C items by batching orders and accepting longer review intervals.
- Slot A items near pick faces and pack stations to cut travel time during picking waves, and place C items in denser, less accessible storage.
- Build exception reports that flag reclassification candidates automatically when a SKU’s consumption value shifts by a set threshold, so the system surfaces drift before it becomes a problem.
These rules work best when storage layout and picking sequence are reviewed together. Our optimized warehouse solutions approach ties slotting decisions to this kind of value-based prioritization rather than treating storage layout as a one-time setup.
Using ABC to prioritize cycle counting and audits
ABC gives you a defensible reason to count some SKUs far more often than others instead of treating every item equally.
- Count A items monthly or more often, since even small discrepancies here carry outsized financial and service risk.
- Count B items on a quarterly cadence, balancing accuracy against labor cost.
- Count C items twice a year or less, since errors here rarely move the needle on service levels.
- Schedule count windows around seasonal peaks so counting doesn’t collide with fulfillment surges, and route any recurring discrepancy back to receiving or picking process checks rather than just correcting the number.
Limitations and when to extend ABC with XYZ or optimization
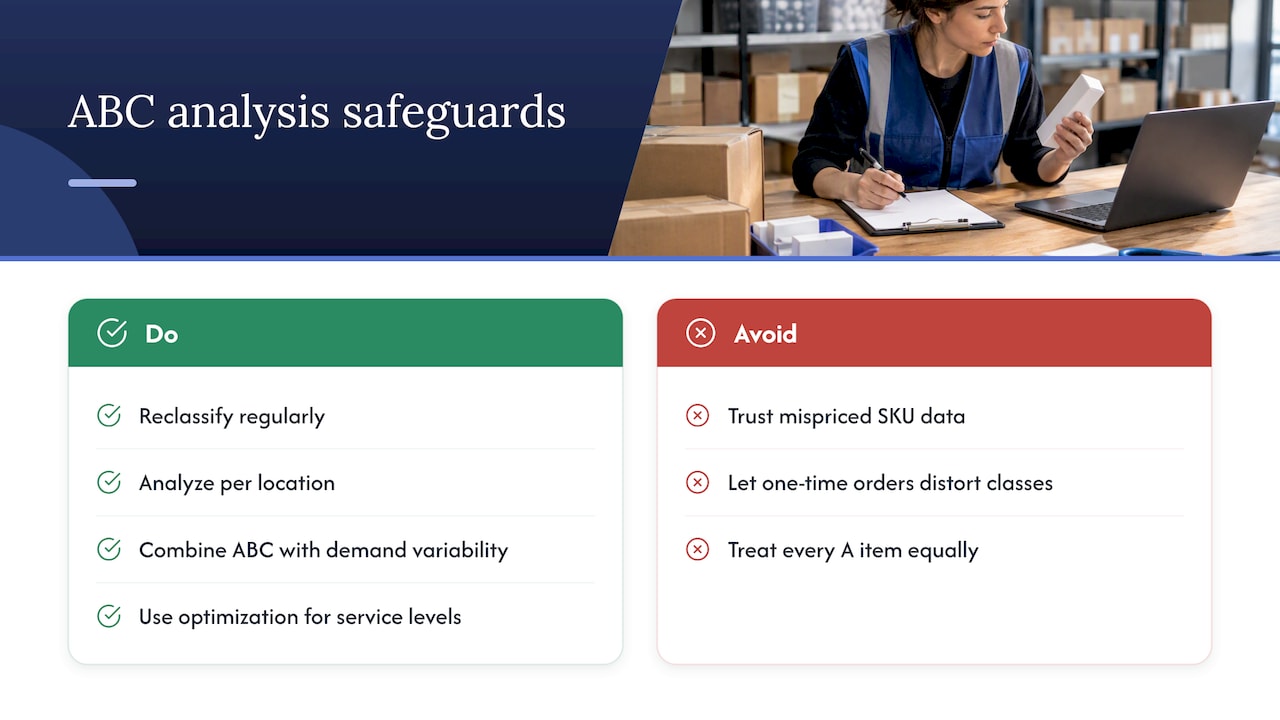
ABC leans entirely on the quality of your cost and usage data, so a mispriced SKU or a one-time bulk order can misclassify an item for months. It also treats every A item as equally important, which breaks down when demand is highly erratic. In those cases, combining ABC with demand variability analysis, often called ABC-XYZ, or applying optimization models that jointly set classification and service levels can outperform a straight ABC cut, as research on ABC grouping decisions has shown. Regular reclassification and per-location analysis reduce most of this risk.
Applying ABC analysis in warehouse and 3PL workflows
Inside a fulfillment operation, ABC classification shapes decisions well beyond a spreadsheet exercise.
- Slotting and pick sequencing: A items go in prime, low-travel locations near pack stations, while C items occupy bulk storage or mezzanine space, a practice detailed in our pick and pack process guidance.
- FBA prep and labeling QA: high-velocity A items get tighter label and barcode checks, including 300 DPI print quality verification, since a labeling error on a fast-moving SKU multiplies into more fulfillment exceptions.
- Inventory reconciliation: pairing ABC with a structured inventory reconciliation checklist and real-time inventory visibility tracking keeps count discrepancies on A items from snowballing into stockouts.
- Storage cost awareness: since warehouse storage fees have climbed in recent years, trimming excess C-item footprint through tighter slotting directly protects margin.
A practical note on keeping ABC useful
The biggest mistake teams make with ABC is treating the first classification as permanent. One client I worked with freed up real cash simply by re-running the analysis quarterly and catching SKUs that had drifted from C to A. Keep the rules simple, review on a fixed cadence, and let data integrity checks catch problems before they reach the floor.
— Akbar
How Universal Shipping helps you operationalize ABC controls
Once your A, B, and C classes are set, the harder part is running the physical operation around them, storage assignment, pick sequencing, and FBA label QA all have to reflect that priority every day. Our 3PL fulfillment services and warehousing and fulfillment solutions are built around exactly that kind of value-based handling, so your A items get the attention they need without manual oversight on every order.

If you want help turning your ABC classification into a working slotting and fulfillment plan, reach out through our pricing and services page to start the conversation.
FAQ
What is ABC analysis in inventory?
ABC analysis is a method that classifies inventory into three groups, A, B, and C, based on annual consumption value (unit cost multiplied by annual units used). A items represent the smallest share of SKUs but the largest share of value, so they receive the tightest controls, according to CIPS.
How do you calculate ABC inventory classification?
You calculate annual consumption value for each SKU, sort them from highest to lowest, then compute a running cumulative percentage of total value.
What are examples of ABC analysis?
Retailers commonly apply ABC analysis to decide which products get tighter stock monitoring and which can run on simpler reorder rules.
What is the difference between ABC analysis and EOQ?
ABC analysis is a prioritization method that groups SKUs by value so you know where to focus attention, while economic order quantity (EOQ) is a formula that calculates the optimal order size for a given item to minimize ordering and holding costs. The two work together: once ABC tells you which items matter most, EOQ helps you decide how much of each to order.
How often should you review ABC classifications?
Fast-moving categories benefit from monthly review, while slower-moving or stable product lines can be reviewed quarterly without losing accuracy. Reviewing regularly keeps the classification aligned with actual demand shifts instead of relying on stale, outdated groupings.
Sources
- ABC Classification & ABC Method | CIPS
- Optimizing ABC Inventory Grouping Decisions (Millstein et al., 2013)